A useful shopping list for body recomposition is short, dense in protein, and organised by what the food contains rather than by what the packet says about itself. Singapore's Health Promotion Board publishes per-100 g and per-portion composition figures for common staples in its national database, and those numbers — not front-of-pack marketing — are what this list is built on (HPB). Prices move constantly and differ between stores, so what follows is organised by protein content instead. This article covers the staples worth keeping in the trolley, how to read the tags on the data, and the two Singapore labelling rules that most shoppers have backwards.
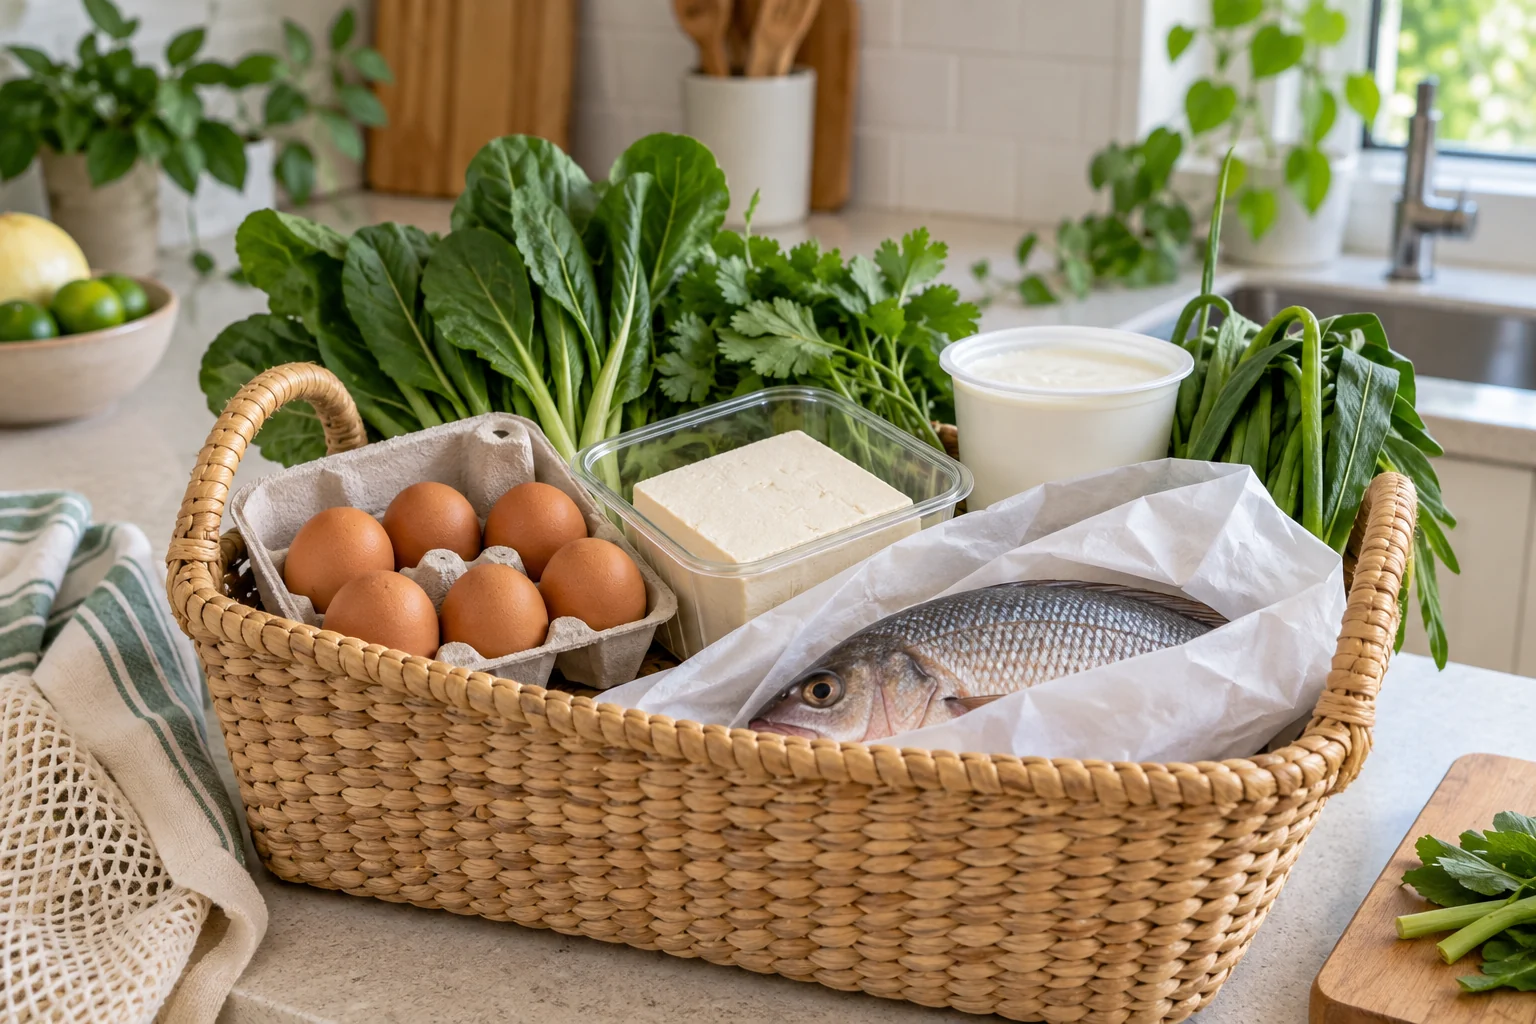
Staple: a food you buy repeatedly and default to without thinking. Getting the staples right does more for a protein target than optimising anything you buy occasionally.
Why the trolley matters more than the meal plan
Guidance during active weight loss lands at roughly 1.2 to 1.6 g of protein per kilogram of body weight per day (Leidy 2015) — for a 70 to 90 kg person, about 85 to 145 g a day. On a suppressed appetite that is a demanding target, and it is won or lost in defaults rather than in decisions. What sits in the fridge on Tuesday evening determines what gets eaten far more reliably than a plan written on Sunday.
The practical implication is that a shopping list should be short. Four or five items you actually eat beat twenty you bought once.
The staples HPB publishes figures for
These are direct reads of HPB's database, retrieved on 1 August 2026, with HPB's own default portion in the third column (HPB).
| Item, as HPB names it | Per 100 g | HPB default portion | Protein in that portion | Source tag |
|---|---|---|---|---|
| Canned tuna in brine, drained | 129 kcal, 26.1 g protein | 1 can, 150 g | 30.93 g | Borrowed, 2025 |
| Chicken breast, raw, without skin | 120 kcal, 22.5 g protein, 2.62 g fat | 1 palm-sized piece, 90 g | 15.8 g | Borrowed, 2025 |
| Chicken breast, raw, with skin | 172 kcal, 20.85 g protein, 9.25 g fat | — | — | Borrowed, 2025 |
| Fried egg | 237 kcal, 15.75 g protein | 1 piece, 39 g | 6.14 g | Lab analysis, 2025 |
| Milk | 67 kcal, 3.39 g protein | 1 glass, 250 ml | 8.48 g | NIP, 2025 |
| Plain tofu | 72 kcal, 6.6 g protein | 1 block, 85 g | 5.61 g | Borrowed, 2025 |
Read in order, that table is a shopping list on its own: a tin, a tray of breast meat, eggs, milk, tofu. It is also the point at which most nutrition content stops and where the useful part begins.
Read the tags before you trust a number
HPB labels every record with how the value was obtained, and the four categories are not equivalent (HPB). Three of them apply here.
Borrowed means it is not a Singapore measurement. HPB states plainly that borrowed values come from other international databases, naming USDA FoodData Central and the Australian Food Composition Database. The chicken, tuna and tofu figures above all carry that tag. They are the best available numbers and they were not measured on food bought here.
Raw is not cooked. The chicken breast record is explicitly raw. Cooking drives off water, so 100 g of raw breast and 100 g of cooked breast are different amounts of meat and different amounts of protein. A raw figure is the right one to shop with and the wrong one to plate with.
Fried is a preparation, not an ingredient. The fried egg record sits at 237 kcal per 100 g, well above what an egg contributes by itself, because the oil is in the number. HPB's egg figure is a lab analysis of a fried egg, and it should be read as such rather than as the cost of eating eggs.
One more caution on variants. HPB's record here is plain tofu, at a block of 85 g. Tau kwa, the firm pressed block used in most local cooking, is a denser and different item, and no figure for it was retrieved in this pass. Do not carry the plain-tofu number across.
The labelling rule almost everyone has backwards
In Singapore, a nutrition information panel is not universally required. HPB's rule is that a panel is mandatory only for pre-packaged foods that carry a health or nutrition claim, for edible fats and oils, for Nutri-Grade beverages, and for special purpose foods (HPB). Everything else may lawfully be sold with no panel at all.
That inverts the intuition most shoppers bring to a shelf. A packet with no numbers on it has not failed to comply — it has simply made no claim, which is what removes the obligation. And a packet covered in numbers is often one that made a claim and therefore had to print them.
Where a panel is required, it must declare energy in kilocalories or kilojoules or both, plus protein, fat and carbohydrate in grams, together with whatever nutrient the claim is about. That is the panel worth reading: protein per 100 g, then protein per serving, then how big the serving is. The third number is where most surprises live.
Read those three in that order and one habit falls out of it. Per-100 g is the only figure that compares two products fairly, because the manufacturer chooses the serving and can choose it small. Per-serving is the figure that tells you what happens when you eat the thing. And the serving size itself is what reconciles them — a tub declaring 12 g of protein per serving at a 100 g serving and one declaring 12 g at a 170 g serving are meaningfully different products, and only the first number reveals it.
Singapore does define thresholds for the phrases "source of protein" and "high in protein", but they sit in an HPB guide whose appendix could not be retrieved — every URL for it returned an error — so no cut-off is quoted here. Compare the panel between two products rather than trusting the phrase on the front.
What the Healthier Choice Symbol actually certifies
The Healthier Choice Symbol identifies packaged products that meet HPB's nutrient criteria for their own food category (HPB). HPB sets those criteria category by category, applicants must have the product analysed by an independent accredited laboratory, and roughly 4,000 products across more than 100 categories carry the symbol, each with a tagline naming the aspect it was awarded for.
The consequence is the thing to hold onto: the symbol is a comparison within a category, not an absolute rating. A symbol on a biscuit identifies a better biscuit. It does not make the biscuit a good choice at three in the afternoon when you are 40 g short of your protein target. Read the tagline — it tells you which nutrient the award was about — and then read the panel.
The symbol is also a separate scheme from Nutri-Grade, which grades beverages A to D. A product can carry either mark, and neither is a statement about the food's place in your day.
Building the list
A workable list has three tiers.
The core. One or two dense animal or soy proteins you will actually cook or open: breast meat, canned fish in brine rather than oil, eggs, tofu. These do the heavy lifting, and the table above shows why — a 150 g can of tuna alone covers roughly a fifth to a third of a typical daily target.
The top-ups. Items that add protein without asking for a meal. Milk at 8.48 g a glass is the clearest example, and it costs almost no capacity on a day when appetite is poor. Plain yoghurt, soya milk and eggs already boiled belong in the same tier. This is the tier that rescues a bad day, and our guide to hitting your protein target when you have no appetite covers how to use it.
The optional tier. Protein powder sits here and nowhere higher. Supplementation adds a modest but real amount of fat-free mass and strength on top of resistance training, with no further fat-free-mass benefit once total intake passes roughly 1.6 g per kg of body mass a day (Morton 2018). It is a way to close a gap conveniently, not a foundation. How to choose protein powder in Singapore covers the rest, including which agency actually regulates it.
Keep the whole thing to about six repeating items. A list long enough to feel comprehensive is a list that produces one good week and then reverts, because it depends on planning every trip. Six items you buy without deciding will still be in the fridge in March, and the target is met on ordinary Wednesdays rather than on ambitious Sundays.
There is no meal plan attached to it either. On a suppressed appetite the constraint is what you can finish rather than what you intended to cook, and a plan written on Sunday tends to lose that argument by Tuesday. Compare the panel in front of you against the figures above and take the denser option — that decision, repeated without ceremony, is the plan.
For the days you are not cooking at all, hawker dishes ranked by protein per calorie covers the same target from the other direction.
At GetLean, our philosophy is that the medication is the catalyst and what you keep is the result. A trolley is a slow, boring lever on that, and it works every week whether or not you thought about it.
Figures describe the specific database records named, with HPB's stated portions, tags and years. Anyone with a medical condition affecting diet, or a food allergy, should speak to a doctor or dietitian.
Common questions
What should I buy at the supermarket to hit a protein target?
Build the trolley around a small number of dense staples rather than a long list. In HPB's database, canned tuna in brine carries 26.1 g of protein per 100 g and raw skinless chicken breast 22.5 g, while milk gives 8.48 g in a 250 ml glass (HPB).
Does every packaged food in Singapore have to show a nutrition panel?
No. HPB requires a nutrition information panel only for pre-packaged products that make a health or nutrition claim, edible fats and oils, Nutri-Grade beverages and special purpose foods (HPB). Many products lawfully carry no panel.
Does the Healthier Choice Symbol mean a food is low in calories?
No. It means the product meets HPB's criteria for its own food category, so a symbol on a biscuit identifies a better biscuit rather than a good food (HPB). It is a comparison within a category, not an absolute rating.
Is the chicken breast figure for cooked or raw meat?
Raw. HPB's record is raw skinless chicken breast at 22.5 g of protein per 100 g, with a default portion of one palm-sized 90 g piece giving 15.8 g (HPB). Cooking changes the weight, so a cooked portion does not map onto the raw figure.
Do I need protein powder if I am shopping properly?
Not necessarily. Supplementation adds a modest amount of fat-free mass on top of resistance training, with no further fat-free-mass gain above roughly 1.6 g per kg of body mass per day (Morton 2018). It is a convenient way to close a gap, not a requirement.