Everything this clinic recommends has to survive contact with an ordinary Tuesday in Singapore: lunch bought at a hawker centre because there is no kitchen time, a commute that supplies more than half the week's movement, and a gym that is public rather than private. Almost none of the research behind those recommendations was conducted in that setting. This guide is the translation layer — the same principles as the rest of the site, rendered into the environment most people here actually live in, with the thin and self-contradictory patches in the local data marked rather than smoothed over.
Per-portion figure: the energy or protein in a named dish at a stated serving weight. A protein number with no portion weight beside it cannot be used, because the portion does half the work.
The evidence was not collected here
Worth saying at the top, because it changes how everything below should be read.
No trial of any eating or training intervention in Singapore shift workers was located. No study has tested outdoor fitness-corner equipment. No trial of resistance training or protein targets has been run in people taking a GLP-1 medication at all — the general weight-loss literature is what protecting muscle on a GLP-1 rests on, and carrying it across is an extrapolation, reasonable because the deficit drives lean-mass loss whatever created it.
The exception is the local data. Singapore publishes its own food-composition database, activity guidelines, fitness-corner workout and population health survey — more ground truth than most countries give a clinic, and it comes with a hazard. Where two official documents cover the same thing they sometimes disagree, and the disagreements here are unusually sharp.
One food source, named
Because there are two, they do not match, and mixing them produces numbers neither source supports.
HPB's Singapore Food Insights Database is publicly queryable and covers over 3,000 foods and drinks sold here. Every record carries the year it was last checked and how the value was obtained: Lab Analysis means a laboratory measured it, Derived means it was calculated from a recipe, Borrowed means it came from the US or Australian national databases, NIP means it was read off a nutrition panel (HPB). A dash means no data, not zero. The variant names are load-bearing — economy rice with one vegetable and one meat is a different record from economy rice with two meats. And HPB's own disclaimer states it makes no guarantees that the data is error-free.
The other source is a peer-reviewed laboratory analysis of 45 dishes bought from a Singapore food court, one outlet per dish, measured by near-infrared spectroscopy in triplicate (Yeo 2021). Both were checked, both are legitimate, and for several of the same dishes they report materially different per-portion energy and protein, because they used different portion definitions and different samples. Nobody has published a reconciliation.
So the rule is one source per article, named. This guide uses HPB's database throughout. The one article here built on the laboratory study instead is hawker dishes ranked by protein per calorie, which says so in its first paragraph. Numbers should not be read across. And nobody — not HPB, not the laboratory study — has sampled several stalls of one dish and published the spread, so figures vary by stall and no published range exists.
How much protein, and per kilogram of what
Two ranges circulate, they use different denominators, and swapping them is the most consequential arithmetic error in this subject.
1.2 to 1.6 grams per kilogram of body weight per day, with meal-specific quantities of at least around 25 to 30 g, from the most widely cited review of protein during weight loss (Leidy 2015). The denominator is total body weight — for a 70 to 90 kg person, roughly 85 to 145 g a day.
2.3 to 3.1 grams per kilogram of fat-free mass per day, from a different population: lean, resistance-trained athletes in caloric restriction (Helms 2014). The denominator is fat-free mass — body weight minus fat — and applying it to body weight instead overstates the target by about 43% at 30% body fat, more as body fat rises.
There is also a ceiling: pooling 49 trials, protein beyond roughly 1.6 g per kg of body mass per day added no further fat-free mass on top of resistance training (Morton 2018).
Where the protein is on a hawker plate
Singapore's own database answers this precisely, and the answer has an inconvenient shape. All figures are HPB's, at HPB's default portion, retrieved 1 August 2026, each with HPB's own data tag (HPB).
| Dish, as HPB names it | Portion | Energy | Protein | Tag |
|---|---|---|---|---|
| Economic rice, 2 meats | 1 plate, 526 g | 768 kcal | 53.7 g | Derived, 2026 |
| Economic rice, 1 vegetable + 1 meat | 1 plate, 553 g | 697 kcal | 34.51 g | Derived, 2026 |
| Fishball noodles, soup | 1 bowl, 798 g | 519 kcal | 33.52 g | Lab Analysis, 2025 |
| Roasted chicken rice | 1 plate, 363 g | 643 kcal | 29.67 g | Lab Analysis, 2025 |
| Char kway teow | 1 plate, 480 g | 989 kcal | 25.73 g | Lab Analysis, 2025 |
| Laksa | 1 bowl, 604 g | 429 kcal | 19.99 g | Lab Analysis, 2025 |
| Steamed chicken rice | 1 plate, 346 g | 488 kcal | 19.22 g | Lab Analysis, 2025 |
| Sliced fish soup, no milk | 1 bowl, 561 g | 84 kcal | 17.05 g | Lab Analysis, 2023 |
| Plain prata | 1 piece, 141 g | 496 kcal | 12.52 g | Lab Analysis, 2025 |
Read it by column and the local problem appears: the plates carrying the most protein are also the heaviest. 53.7 g arrives in a 526 g plate; 33.52 g in a 798 g bowl. Appetite is exactly what a GLP-1 medication reduces — in a randomised trial of 72 adults with obesity, intake at a single ad libitum test lunch was 35% lower on semaglutide 2.4 mg than on placebo (Friedrichsen 2021), one laboratory meal rather than an ordinary day, and what GLP-1 medication does, and what it does not covers that appetite mechanism in full. Once the constraint is volume rather than calories, which half of the plate gets finished decides the meal. Eating at a hawker centre on a small appetite works that sequencing through.
The outlier is sliced fish soup without milk: 17.05 g of protein for 84 kcal. HPB separately identifies 56 dish categories providing 500 kcal or less under its Healthier Dining Programme (HPB) — a calorie ceiling with no protein figure attached, so it shortlists, and the order is then decided for the protein inside the shortlist. Hawker dishes ranked by protein per calorie sets out how a full day adds up.
Two places where the database has nothing, and where a number is easy to manufacture. There is no mala xiang guo record — only a mala chicken component at a 100 g scoop, and scaling a scoop to a bowl produces a figure HPB never published. And no zi char dish appears in any Singapore composition source at all. Mala, prata and cai fan covers what the database does and does not answer; zi char, ordered lean reasons from the menu, because that is all there is.
Groceries carry the same caveats one level down. HPB publishes per-100 g protein for staples — raw skinless chicken breast 22.5 g, canned tuna in brine drained 26.1 g, plain tofu 6.6 g, a 250 ml glass of milk 8.48 g, a fried egg 6.14 g — but the meat, fish and tofu records are tagged Borrowed, from the US or Australian databases rather than Singapore measurement, and the chicken figure is raw (HPB). Tofu is the surprise: a whole 85 g block supplies about 5.6 g. The packet is a weaker guide than the database in any case. A nutrition information panel is not universally mandatory here — HPB requires one only for products making a health or nutrition claim, edible fats and oils, Nutri-Grade beverages and special purpose foods (HPB) — and the Healthier Choice Symbol is a within-category comparison, so a symbol on a biscuit means a better biscuit (HPB). No numeric threshold for either can be quoted. A lean supermarket shopping list for Singapore is built on composition figures rather than on brands or front-of-pack marks.
The drinks, where a careful day quietly stops being careful
One clean comparison exists, and one very popular one does not.
HPB's database puts a regular 250 ml kopi at 193 kcal and 19.05 g of sugar, and the same cup ordered as kopi O kosong at 33 kcal and 0 g — both records tagged Derived, 2026, meaning calculated from a recipe rather than laboratory-measured (HPB). The vocabulary is HPB's own too: C is evaporated milk, O is no milk, kosong is no sugar, siu dai is less sugar. The one that catches people is O — ordering kopi O removes the milk and keeps the sugar, and HPB's record for it still carries 11.73 g.
The siu dai claim is where this comes apart. HPB's consumer page tells the public that ordering siu dai removes about one and a half teaspoons (HPB). HPB's own 2026 database records kopi siu dai at 20.1 g of sugar against plain kopi's 19.05 g — higher, not lower (HPB). Both documents are HPB's, they cannot both be right about the same cup, and no arithmetic reconciles them, so no siu dai saving appears anywhere in this cluster. The kosong comparison is the one that holds. "Gah dai" appears nowhere in either, so it is stall vocabulary with no authoritative figure attached.
Nutri-Grade is separate and narrower. Since 30 December 2022 drinks have been graded A to D on sugar and saturated fat per 100 ml; C and D drinks must carry the mark front-of-pack, grade-D advertising is prohibited, and the rules were extended to freshly prepared beverages on 30 December 2023 (HPB and MOH). It covers beverages only and grades two nutrients. Kopi, teh and the sugar you do not count goes through the full ladder.
Training: what the country actually provides
Two public options, and one structural difference decides which is which.
ActiveSG. Membership is free to sign up for. As displayed on Sport Singapore's own individual-rates page on 1 August 2026, gym entry was $2.50 for a Singapore citizen or permanent resident aged 18 to 54 and $1.50 for a student aged 12 to 17 or a senior aged 55 and over (Sport Singapore). Those are live government pages and the rates change, so the date travels with the figures and they should be re-checked before anyone relies on them. There are 28 ActiveSG gyms, holding free weights and variable-resistance machines (MCCY).
Outdoor fitness corners. Over 3,400 across HDB estates, Sport-in-Precinct sites and NParks parks — and the Government's own description of the equipment is the whole story: most use fixed-resistance or body-weight (MCCY). The load cannot be increased, so progression has to come from repetitions, tempo, leverage, single-limb work and proximity to failure instead.
That constraint is why one finding does all the load-bearing work. Pooling 21 studies in which every set was taken to muscular failure, muscle growth was similar whether the load sat at or below 60% of one-rep max or above it, while strength gains were significantly greater with heavier loads (Schoenfeld 2017); a 12-week trial in 49 trained young men found 30–50% of one-rep max taken to failure produced the same fibre growth as 75–90% (Morton 2016). The condition does the work. A comfortable set of 15 on a leg press station does not inherit that result; a set that ends because another good repetition is not possible might.
Singapore publishes two strength prescriptions and they do not agree. HPB's fitness-corner resource asks for at least three strength exercises at 2 to 3 sets of 15 repetitions (HPB); the Singapore Physical Activity Guidelines, issued jointly by HPB and Sport Singapore, give 8 to 12 repetitions per set (SPAG 2022). Two HPB documents, two numbers, neither withdrawn and no published reconciliation — so anyone quoting a repetition range should name which document it came from rather than averaging them. Both agree, and WHO makes a strong recommendation on moderate-certainty evidence, on strengthening work at least two days a week (WHO 2020).
The floor is low. In resistance-trained men, a single hard set per exercise taken to failure, two to three times a week, produced significant strength gains over 8 to 12 weeks — a dose the authors themselves call suboptimal, tested in trained men only (Androulakis-Korakakis 2020). Above it, volume matters in a graded way with diminishing returns, and the widely repeated "10 sets a week" threshold comes from a categorical comparison that was not statistically significant (Schoenfeld 2017, volume).
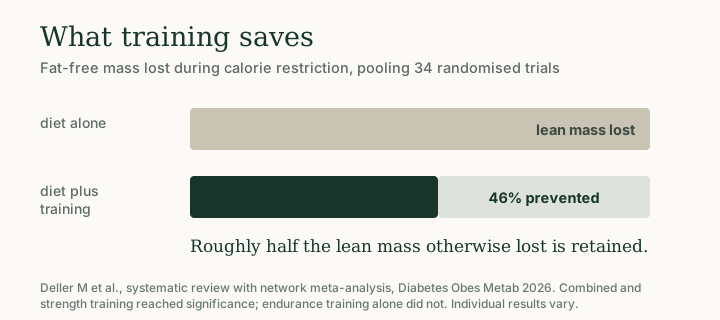
Why it matters during weight loss: pooling 34 randomised trials, adding exercise to a calorie-restricted diet prevented roughly 46% of the fat-free mass otherwise lost — mixed training +1.20 kg, strength +0.83 kg, endurance +0.51 kg at p=0.067, with subgroup testing finding no significant differences between the modes (Deller 2026). Strength and combined training are the modes with demonstrated protection; aerobic alone is unproven for it, an absence of evidence rather than evidence of harm.
Resistance training at an ActiveSG gym covers what adjustable load buys, and fitness corners and home setups covers progression when the load cannot go up.
A desk, and what it does and does not do
A desk job is a mortality problem with good evidence behind it and a body-composition problem with almost none. Most advice for office workers has this the wrong way round.
The systematic review that asked the composition question directly — 31 publications, 23 prospective cohorts and one randomised trial — found small, inconsistent and non-significant associations between sedentary behaviour and body weight. Its single significant result was waist circumference, at 0.02 millimetres per daily hour of sitting accumulated over five years (Campbell 2018). Read the unit twice. It reached significance because the pooled sample was enormous, and quoting it without its unit misleads badly.
The mortality evidence sits on entirely different ground. In a harmonised analysis of 1,005,791 people, sitting more than eight hours a day carried a hazard ratio of 1.59 for death from any cause among the least active quartile, and 1.04 — not significant — among the most active (Ekelund 2016). The authors conclude that roughly 60 to 75 minutes a day of moderate activity appears to eliminate that excess, with three qualifications attached: it is observational, it did not eliminate the risk from television viewing, and 60 to 75 minutes is roughly double Singapore's national guideline. WHO reached the same place from the guideline side, telling adults to replace sedentary time with activity of any intensity while declining to set a numeric threshold (WHO 2020).
Singapore's own survey supplies the number that describes a desk-bound week most precisely. In 2024, 84.7% of residents aged 18 to 74 had sufficient total physical activity while only 35.7% did sufficient muscle-strengthening activity — and commuting contributed 51.6% of weekly total activity, against 24.7% from leisure and 23.6% from work (NPHS 2024). Those are HPB's and MOH's figures; the reading is ours. More than half of the average adult's activity is getting to places, which is genuine activity and is not resistance training. A work-from-home day removes a large share of the week's movement without anything feeling different, and the strengthening half of the guideline is the half the country has not absorbed. Desk-bound in the CBD turns that into a week.
Shifts, nights and hours that move
The association is real, the evidence is observational, and the study designs disagree with each other in a way that is itself the finding.
Pooling 26 studies and 311,334 participants — 7 cohort, 18 cross-sectional, 1 case-control — shift work carried a relative risk of 1.25 for overweight and 1.17 for obesity, the authors flagging substantial heterogeneity because the underlying studies used different cut-offs (Liu 2018). A second analysis of 28 night-work studies gave overall odds of 1.23, then split them: cross-sectional 1.26, cohort 1.10. Permanent night workers showed 1.43 against 1.14 for rotating shifts, and abdominal obesity was the strongest signal at 1.35 (Sun 2018).
A cross-sectional study photographs a workforce once, so heavier people being more likely to take or stay in night work fits the data as well as night work adding weight does. A cohort study follows the same people forward, and reports less than half the excess. The cut-off matters here too: Singapore's national scale classifies overweight from a BMI of 23 and obese from 27.5, while much of the underlying research used 25 and 30. Shift work travels with higher rates. No roster has been shown to have caused any individual's weight.
The meal-timing work that looks like an answer is smaller than it sounds: in a randomised laboratory trial, 19 people undergoing simulated night work ate either by day or by night, and daytime eating prevented the glucose intolerance seen in the night-eating group (Chellappa 2021). No weight, fat or lean-mass outcome was measured — and skipping meals is not something to attempt on appetite-suppressing medication without a doctor's input. Shift work and getting lean covers the full picture.
One boundary belongs here explicitly. Shift work is also associated with about 9% higher odds of diabetes in pooled observational data, more strongly in men (Gan 2015) — context for why a shift worker's risk profile differs from a day worker's, and nothing beyond it. GetLean is a weight-management service; we do not treat, prevent or reverse diabetes.
The national numbers, with their definitions attached
Four things about Singapore's own figures get reversed constantly, and the current survey settles all four (NPHS 2024).
Obesity rose. Diabetes did not. Obesity among residents aged 18 to 74 rose significantly from 10.5% to 12.7%, while diabetes prevalence "remained stable" at 9.1% against 9.5%, the age-standardised figure falling to 8.8%. Turning that into a story about diabetes reverses the one indicator Singapore has held steady.
Two BMI scales run at once. 12.7% is the international cut-off of BMI ≥30. 22.8% is the separate Asian high-risk band at BMI ≥27.5. Different questions, routinely swapped.
The date is a two-year pool. Obesity and diabetes come from a health examination aggregated across the 2023 and 2024 surveys; the activity figures are 2024 interview data. The population is residents aged 18 to 74 — not all Singaporeans, and not any individual reader.
"One million by 2050" is not an MOH forecast. The projection appears in MOH's own War on Diabetes report, footnoted there to a 2014 study by the Saw Swee Hock School of Public Health at NUS (MOH). Attributing it to MOH is the commonest single error in Singapore health writing.
Singapore declared its War on Diabetes in 2016, structured around healthy living and prevention, early detection and intervention, and better disease management (MOH). It is a government public-health programme and this clinic sits outside it: GetLean is a private weight-management service, and diabetes is a named disease managed by a person's own doctor. Singapore's obesity and diabetes trends, accurately states each figure with its definition.
What a Singapore week actually looks like
Nothing above requires a different life. It requires four decisions, three of which repeat daily.
- Two strength sessions a week — the half of Singapore's guideline that roughly two-thirds of adults miss (NPHS 2024), and the half with demonstrated fat-free-mass protection during weight loss (Deller 2026).
- A protein anchor at each meal — the fish, chicken, egg or tofu first, then the decision about rice, because the part eaten first is the part that counts.
- The drink treated as a decision — a kopi ordered kosong rather than standard differs by roughly 160 kcal and 19 g of sugar on HPB's figures (HPB).
- The commute protected — if more than half your weekly activity is getting places, a longer walk to a further station is a real intervention (NPHS 2024).
At GetLean, our philosophy is that GLP-1 medication should act as a catalyst — not something to depend on indefinitely. What decides how much of the result survives is what happens at a hawker centre and at a fitness corner, in the environment the patient lives in rather than the one the trials ran in. Clinical-trial figures describe the populations studied; individual results vary and are not guaranteed. If you are considering treatment, check your eligibility and speak to a doctor about whether it is suitable for you.
Common questions
Can you get enough protein from hawker food?
Yes, and Singapore's own database shows it. HPB records an economy rice plate with two meats at 526 g, 768 kcal and 53.7 g of protein, and a sliced fish soup without milk at 561 g, 84 kcal and 17.05 g (HPB). The difficulty is rarely availability — it is that the protein-dense plates are the heavy ones, so on a small appetite which part gets eaten decides the meal.
Which figures should you trust for a hawker dish?
One source at a time, named. HPB's national database and a peer-reviewed laboratory analysis of food-court dishes both exist, both were checked, and they report materially different per-portion energy and protein for several of the same dishes because they used different portion definitions and different samples (HPB, Yeo 2021). Reading one against the other produces an answer neither supports. This guide uses HPB throughout.
Does ordering siu dai save sugar?
No figure for it can be sourced. HPB's consumer page says siu dai removes roughly one and a half teaspoons (HPB), while HPB's own 2026 database records kopi siu dai at 20.1 g of sugar against plain kopi's 19.05 g — higher, not lower (HPB). The comparison that holds is kosong: a 250 ml kopi at 193 kcal and 19.05 g of sugar against kopi O kosong at 33 kcal and none.
Can you build muscle at a fitness corner?
The route that supports it is effort rather than equipment. Most of Singapore's 3,400-plus outdoor fitness corners use equipment the Government describes as fixed-resistance or bodyweight, so the load cannot be increased (MCCY). Light loads match heavy ones for muscle growth only when every set is taken to muscular failure (Schoenfeld 2017, Morton 2016). No study has tested fitness-corner equipment itself.
Does sitting at a desk all day make you gain fat?
The best-designed synthesis on the question found small, inconsistent and non-significant associations between sedentary behaviour and body weight, and its only significant result was 0.02 millimetres of waist circumference per daily hour of sitting over five years (Campbell 2018). The well-evidenced harm from sitting is mortality: over eight hours a day carried a 59% higher risk of death in the least active quartile of a million-person analysis (Ekelund 2016).
Does shift work cause weight gain?
Nobody has shown that. The evidence is entirely observational, and where the pooled analyses separate designs the cohort studies report about half the excess the cross-sectional ones do — 1.10 against 1.26 for overweight or obesity (Sun 2018). A second analysis of 26 studies gives relative risks of 1.25 for overweight and 1.17 for obesity, its authors flagging different obesity cut-offs across the underlying studies (Liu 2018).