Most hawker nutrition content online is guesswork dressed up with decimal places. This article uses laboratory-measured values from a peer-reviewed compositional study of dishes bought at a Singapore food court and analysed in triplicate. There are eleven dishes here rather than thirty, because eleven is how many we could verify. The ranking is also less useful than it looks on its own, and the second half of the article explains why.
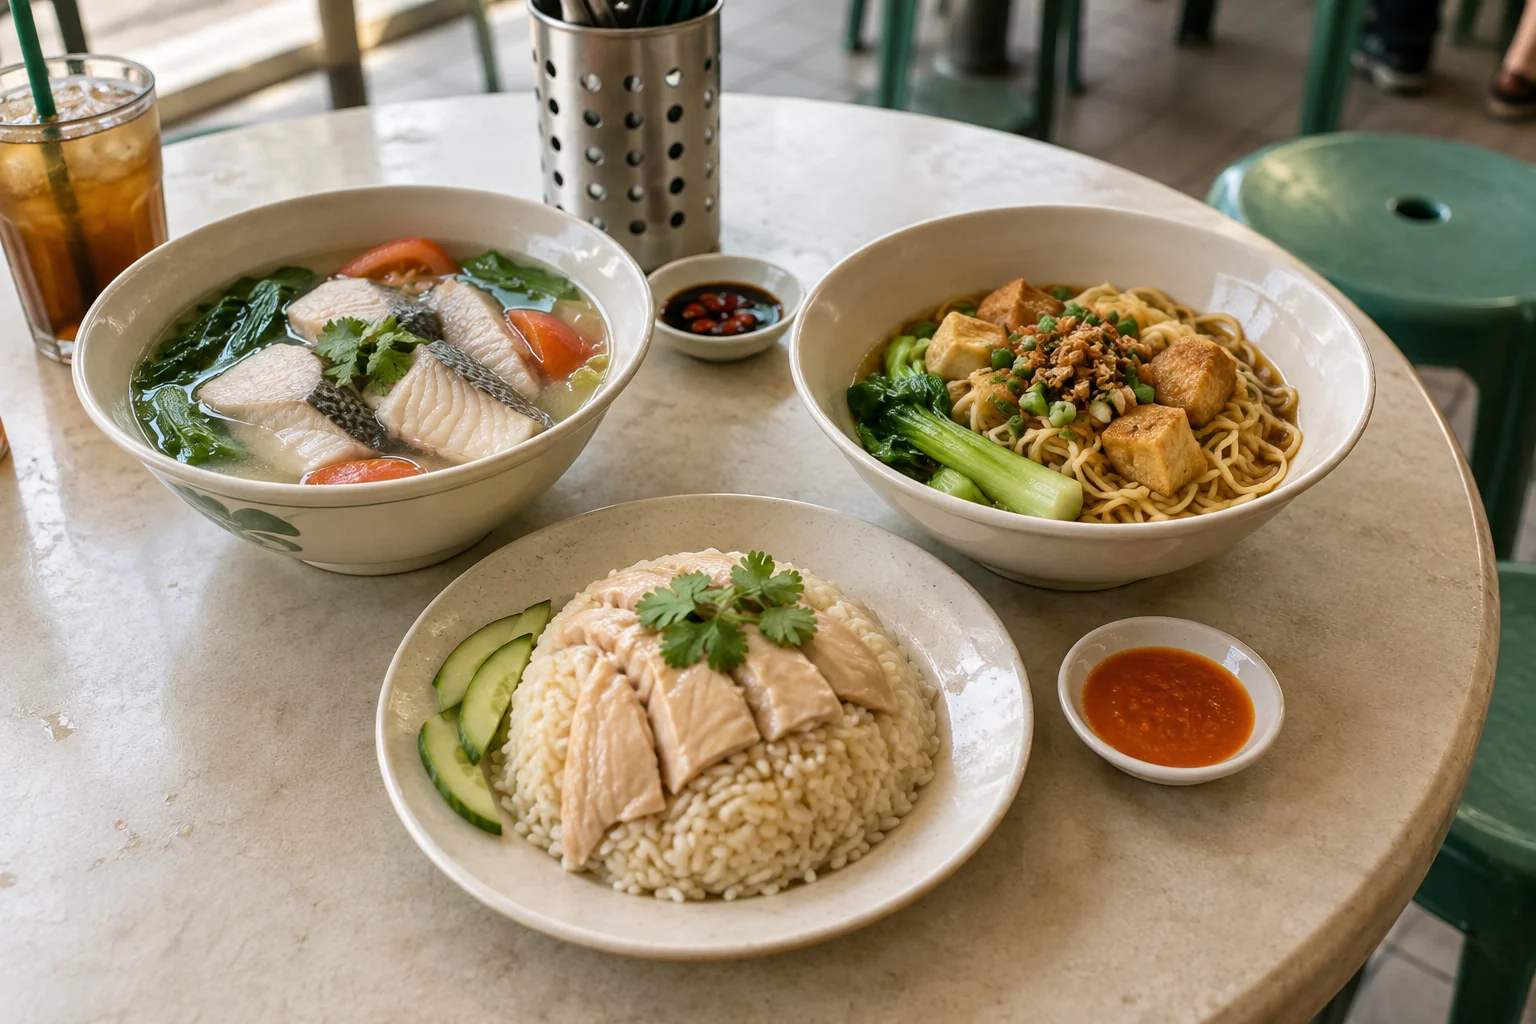
Protein per 100 kcal: how much protein a dish delivers for each 100 calories it costs. Useful when calories are limited; useless on its own if the portion is enormous.
The ranking
Values are per portion as measured, with portion weight stated. Energy is converted from the kilojoule figures the study reports (Yeo 2021).
| Dish | Portion | Energy | Protein | Protein per 100 kcal |
|---|---|---|---|---|
| Char siew wanton noodle | 335 g | 402 kcal | 26.5 g | 6.6 g |
| Laksa | 577 g | 881 kcal | 46.2 g | 5.2 g |
| Minced meat mee pok | 383 g | 620 kcal | 31.8 g | 5.1 g |
| Steamed chicken rice | 412 g | 777 kcal | 38.3 g | 4.9 g |
| Nasi lemak | 395 g | 741 kcal | 36.3 g | 4.9 g |
| Roasted chicken rice | 285 g | 523 kcal | 23.7 g | 4.5 g |
| Ban mian (dry) | 311 g | 462 kcal | 20.8 g | 4.5 g |
| Fried hokkien mee | 328 g | 446 kcal | 18.0 g | 4.0 g |
| Char kway teow | 362 g | 659 kcal | 14.5 g | 2.2 g |
| Economical mee goreng | 350 g | 566 kcal | 12.3 g | 2.2 g |
| Roti prata | 246 g | 511 kcal | 6.2 g | 1.2 g |
Read the ranking properly
The top of this table is not a shopping list, and treating it as one would be a mistake.
Laksa is the clearest example. It ranks second on protein density and it is the highest-calorie dish measured, at 881 kcal in a 577 g portion. If your constraint is calories — which it usually is during weight loss — a dish being efficient per calorie does not help if the portion delivers a large number of them. Protein density and absolute portion size are two separate questions and you need to answer both.
Char siew wanton noodle wins on both counts here, at 26.5 g of protein for 402 kcal — the highest protein density and the lowest total energy of the eleven. That combination is what actually makes a dish useful.
The bottom of the table is the more actionable end. Roti prata at 1.2 g per 100 kcal and char kway teow at 2.2 g are not moral failures, but if you are trying to reach a protein target on a suppressed appetite, they consume a lot of your available capacity and return very little of what you needed. That is the practical use of a table like this: not to find the winner, but to know what the expensive choices cost you.
The caveats, stated properly
These figures deserve their limits attached.
They are not HPB figures. They come from a peer-reviewed study, not from Singapore's national food composition database, which we could not access to verify anything against. Anyone presenting hawker figures as official HPB data should be able to show you where.
One outlet per dish. Each dish was bought from a single food court and analysed, rather than averaged across stalls. Hawker portions and recipes vary enormously between stalls, so treat these as well-measured examples rather than national averages.
The variants are specific. It is the char siew wanton noodle, the dry ban mian, the mee pok version of minced meat noodle, an economical mee goreng, and two distinct chicken rice preparations. Steamed and roasted chicken rice differ substantially — 38.3 g of protein against 23.7 g — partly because the measured portions differed in size. Do not carry a figure across to a variant that was not measured.
Energy was measured by near-infrared spectroscopy, not bomb calorimetry, and per-portion values are derived from the study's per-100 g figures.
The dishes we could not verify
Worth naming, so you know what is missing rather than assuming the list is complete.
HPB's Healthier Dining Programme identifies certain dish categories as providing 500 kcal or less, and several common dishes appear there — fish sliced bee hoon without milk, fish sliced soup, yong tau foo with no more than two fried items of six, economy rice with two non-fried vegetables, Hakka thunder tea rice, fishball noodles, and minced pork noodles (HPB). That tells you a ceiling. It does not give an exact energy figure and gives no protein figure at all.
For satay, chicken chop, mala xiang guo, popiah, soya beancurd, and half-boiled eggs with toast, we found no official or peer-reviewed figure at all. There are plenty of numbers for these online. None of them traced back to a source we could check, so they are not here.
How to use this against a protein target
The target during active weight loss sits at 1.2–1.6 g of protein per kg of body weight per day (Leidy 2015) — roughly 84–144 g daily for a 70–90 kg person. Evidence also favours spreading it: in a small controlled-feeding study of eight people, roughly 30 g at each of three meals produced more 24-hour muscle protein synthesis than the same total concentrated into dinner (Mamerow 2014).
Look at the table with that 30 g figure in mind and the picture is encouraging. Four of the eleven clear it in a single serving: laksa at 46.2 g, steamed chicken rice at 38.3 g, nasi lemak at 36.3 g and minced meat mee pok at 31.8 g. The char siew wanton noodle comes close at 26.5 g, and does so for the fewest calories of any dish measured. The roasted chicken rice, at 23.7 g, does not clear it — which is exactly why the variant matters. The problem in Singapore is rarely that protein is unavailable — it is that the cheapest and most convenient options at the bottom of the table deliver almost none of it.
Hitting your protein target with no appetite covers the harder version of this problem.
At GetLean, our philosophy is that the medication is the catalyst and what you keep is the result. Protein at a hawker centre is where that gets decided three times a day.
Figures are from the cited study and describe the specific portions measured there. Individual dishes vary by stall. Anyone with a medical condition affecting diet should speak to a doctor or dietitian.
What a day hitting around 120g looks like at hawker centres
The ranking above is per dish. Assembled across a day, and taking in the convenience-store options a hawker centre sits next to, it looks like this.
The table below uses approximate figures based on typical hawker portions. Actual protein content varies by stall, portion size, and preparation method — treat these as order-of-magnitude guides, not precise values.
| Meal | Dish | Approximate protein |
|---|---|---|
| Breakfast | 2 soft-boiled eggs + kaya toast (wholemeal) | ~12–15 g |
| Breakfast top-up | 1 glass of fresh soya milk (large) | ~8–10 g |
| Lunch | Sliced fish soup (generous fish portion, reduced rice) | ~25–35 g |
| Afternoon snack | 1 hard-boiled egg + 1 small Greek yoghurt (NTUC) | ~18–22 g |
| Dinner | Economic rice: steamed chicken + braised tofu + 1 egg | ~30–40 g |
| Evening top-up | 1 glass of fresh milk or a small protein shake | ~8–15 g |
| Day total | ~100–135 g |
The spread is wide. Conservative portions might land around 100 g; picking the denser items and adding an extra egg or tofu portion can exceed 130 g. Both are achievable without cooking.
Common questions
Which hawker dish has the most protein per calorie?
Of the dishes with published laboratory measurements, char siew wanton noodle was highest at about 6.6 g of protein per 100 kcal, followed by laksa at 5.2 g and minced meat mee pok at 5.1 g (Yeo 2021).
Is laksa a good protein choice?
It ranks well on density and poorly on total energy — 46.2 g of protein in an 881 kcal portion (Yeo 2021). If calories are the constraint, a dish can be efficient per calorie and still be a large number of calories.
How much protein is in chicken rice?
In this study, a 412 g steamed portion contained 38.3 g of protein and 777 kcal, and a 285 g roasted portion 23.7 g and 523 kcal (Yeo 2021). Portions vary between stalls.
Which hawker dishes are lowest in protein per calorie?
Roti prata at about 1.2 g per 100 kcal, with char kway teow and economical mee goreng around 2.2 g (Yeo 2021).
Are these HPB figures?
No. They are from a peer-reviewed compositional analysis of dishes bought at one food court, not from HPB's food composition database. Treat them as well-measured examples rather than national averages.