Divide your waist by your height. If the answer is under 0.5, you are inside the boundary that discriminated cardiometabolic risk best across 78 studies in 14 countries. It costs a tape measure, it takes ten seconds, and it outperformed BMI in the pooled data. This article covers where the boundary comes from, how to measure properly, and what it does not tell you.
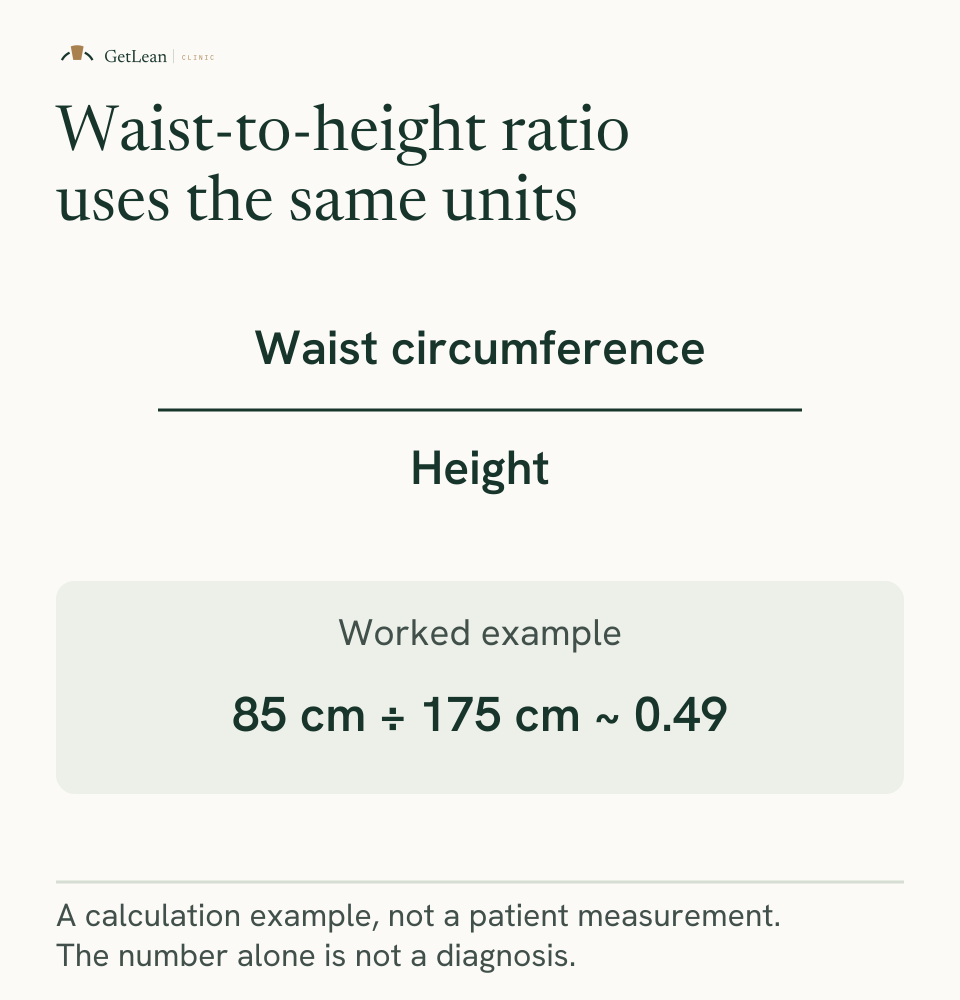
Waist-to-height ratio: waist circumference divided by height, in the same units. A 175 cm person with an 85 cm waist has a ratio of 0.49.
Where the 0.5 boundary comes from
A systematic review pooled 78 studies across 14 countries, covering Caucasian, Asian and Central American populations. The mean boundary value across all outcomes and countries came out at 0.50 for both men and women, supporting the public-health message to keep your waist to less than half your height (Browning 2010).
The same review reported mean AUROC — a measure of how well a test discriminates — of 0.704 for waist-to-height ratio, 0.693 for waist circumference and 0.671 for BMI. Better, in that order, consistently.
A separate meta-analysis pooling more than 300,000 adults across 31 studies found waist-to-height ratio improved discrimination over BMI by 4–5%, and was significantly better than waist circumference for diabetes, hypertension, cardiovascular disease and all outcomes combined, in both sexes (Ashwell 2012).
One thing to be precise about, because the two papers get conflated: the 0.5 boundary comes from the 2010 review; the 4–5% improvement figure comes from the 2012 meta-analysis. And that improvement is in a discrimination statistic — it does not mean the measure detects 4–5% more disease.
Treat 0.5 as a screening heuristic derived from pooled, heterogeneous studies, not as a diagnostic cut-point. It sorts people into "probably fine" and "worth a closer look".
How to measure it properly
Most of the error in this measure is in how it is taken.
- Same spot every time. Midway between the lowest rib and the top of the hip bone is the usual landmark. Consistency matters more than which convention you pick.
- Against skin or thin clothing, not over a jumper.
- Standing relaxed, at the end of a normal breath out. Not holding your stomach in, and not pushing it out.
- Tape snug but not compressing the skin.
- Same time of day, ideally before eating.
Monthly is plenty. It moves slowly enough that weekly measurement mostly captures technique variation.
Why it is the right measure during weight loss
Because it responds to the thing you want to lose and ignores the thing you want to keep.
Body weight is the sum of fat and lean mass changes, which can move in opposite directions — someone losing fat while holding muscle sees a scale that badly understates their progress. Waist circumference does not have that problem. It falls as fat comes off and is largely unmoved by preserved muscle.
That makes it the natural companion to strength as a progress measure, and a far better one than the scale. We cover why in why the scale is the worst way to track progress.
It also catches something BMI misses. In an analysis of 6,171 adults, people with a normal BMI but high body fat had more cardiometabolic risk factors, and among women a significantly higher cardiovascular mortality risk (Romero-Corral 2010). BMI did not identify them. A waist measurement is far more likely to.
The Singapore context
Two things are worth knowing locally.
Singapore's own clinical practice guidelines use waist-circumference action points of above 90 cm for men and above 80 cm for women, alongside BMI thresholds of 23 for overweight and 27.5 for obesity (HPB-MOH 2016). Those are absolute waist figures rather than a ratio, and they are what a Singapore clinician is likely to work from.
The reason local thresholds sit lower is that risk appears at lower body sizes here. In a Singapore population study, cardiovascular risk-factor prevalence ran between 41% and 81% at BMI levels of 22–24 and waist circumferences of 75–80 cm in women and 80–85 cm in men — with odds ratios of 1.97 to 4.38 against reference (Deurenberg-Yap 2002). That is below the standard international overweight threshold.
The practical reading: the 0.5 boundary is a good general heuristic and the pooled review included Asian populations, but if a Singapore clinician is assessing you, they are likely using the local waist figures. Neither replaces the other.
What it does not tell you
It is a screening measure for cardiometabolic risk. It says nothing about how much muscle you have, nothing about fitness, and nothing on its own about whether any treatment is appropriate.
It also cannot distinguish why a waist is a given size, which is why it belongs alongside other information rather than in place of it.
At GetLean, our philosophy is that the composition is the goal and the weight is a by-product. Waist-to-height ratio is the cheapest measure that actually tracks composition rather than mass, which is why it is the one we would point someone to first.
Individual circumstances vary. This is a screening heuristic and not a diagnosis — anything it flags is a reason to speak to a doctor, not a conclusion.
Common questions
What is a healthy waist-to-height ratio?
Below about 0.5. Across 78 studies in 14 countries, a boundary of approximately 0.50 for both men and women best discriminated cardiometabolic risk (Browning 2010).
How do you measure waist-to-height ratio?
Divide waist circumference by height in the same units. Measure at the same landmark each time, against skin, standing relaxed at the end of a normal breath out, with the tape snug but not compressing.
Is waist-to-height ratio better than BMI?
Modestly, and consistently. Mean AUROC was 0.704 for waist-to-height ratio against 0.671 for BMI across 78 studies (Browning 2010), and a meta-analysis of over 300,000 adults found it discriminated risk better than both BMI and waist circumference (Ashwell 2012).
Does the 0.5 boundary apply in Singapore?
The review deriving it pooled 14 countries including Asian populations (Browning 2010). Separately, Singapore's guidelines use waist-circumference action points of 90 cm for men and 80 cm for women (HPB-MOH 2016), which is what a local clinician is likely to apply.
Why use waist rather than weight during treatment?
Because waist responds to fat loss and is largely unaffected by preserved muscle, while body weight sums both changes and can understate real progress.