Weight and body composition are two different measurements, and only one of them tells you whether a result will hold. Every kilogram lost is a mixture of fat and lean tissue. The mixture is what decides the outcome, and a set of scales cannot see it — it reports a total and stays silent on what the total is made of. This guide covers what lean mass does, what the trial data actually show about how much of it comes off during substantial weight loss, what protects it, how to measure the difference in Singapore, and what a good result looks like when it is judged on composition rather than on kilograms.
Body composition: what body weight is made of — fat mass, and lean tissue including muscle, bone and body water. Two people at the same weight can have very different compositions, and one person can change composition substantially with no movement on the scale at all.
Why weight and composition are not the same measurement
Body weight is a single total. Body composition is the breakdown of that total. Losing weight means the total went down; getting lean means the ratio underneath it improved. Those two things usually move together, but not always, and where they diverge is exactly where results are won or lost.
The reason weight became the default number is not carelessness. It is cheap, instant, reproducible on any set of scales, and it is the endpoint the pivotal trials used — so a programme measured that way can be compared against published results. The limitation is narrower than "the wrong tool": weight is a good measure of how much changed and a silent one on what changed. The metric was inherited from a literature that asked a different question, and the blind spot that creates in a weight-loss programme is structural rather than anyone's oversight.
You can see how thin the composition evidence is by looking at the trials themselves. The DXA body-composition sub-study of SURMOUNT-1 covered 160 people (Look 2025). The equivalent DXA analysis in STEP 1 covered 140 and was presented as a conference analysis rather than a peer-reviewed paper (Wilding 2021), while the parent trial randomised 1,961. Composition was a small side question in trials whose main question was weight.
The practical consequence for a patient is that the scale is most persuasive precisely when it is least informative. A large, fast fall in body weight feels like unambiguous progress, and it is the situation in which the fat-to-lean split matters most. Losing weight and getting lean are not the same thing sets out that distinction in full, and why the scale misleads on a GLP-1 medication covers what to watch instead.
What lean mass does, and why losing it costs more than it looks
Lean mass is everything in the body that is not fat — muscle, bone, organs, and the water held in all of them. Muscle is the part of it that a person can influence, and it does three jobs that are worth naming because they explain why the accounting matters.
It is the body's principal reservoir of amino acids, drawn on to keep protein synthesis going in vital tissues when intake falls short — a role a long-standing review argues has been systematically undervalued in how metabolic health is assessed (Wolfe 2006). It is the dominant site at which insulin moves glucose out of the bloodstream (DeFronzo 2009); that is physiology, not a claim about treating any disease. And relative muscle mass tracks with how long people live: in an older-adult cohort of 3,659 people, the highest quartile of muscle mass index carried roughly 20% lower adjusted mortality risk than the lowest (Srikanthan 2014). That cohort was aged 55 and over, and the finding is an association rather than a demonstration that adding muscle extends life.
Strength carries its own separate signal. Across 139,691 adults in 17 countries, each 5 kg lower grip strength was associated with about 16% higher all-cause mortality and 17% higher cardiovascular mortality (Leong 2015). That is observational, and grip strength is a strength measure rather than a measure of muscle mass — a distinction that matters more than it first appears, and one this guide returns to under measurement.
The asymmetry is the point. Lean tissue is far easier to protect on the way down than to rebuild afterwards, which is why it belongs in the plan from the first week rather than as a repair job at the end. What lean mass is and why losing it matters goes through the mechanisms in detail.
How much of the weight lost is lean tissue?
There is no fixed percentage, and any source that gives you one is overstating what is known. What the evidence gives instead is a range, with the drivers of that range reasonably well characterised.
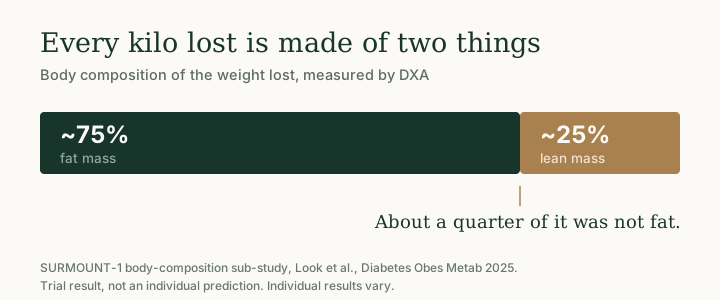
In the SURMOUNT-1 body-composition sub-study, 160 people were scanned by DXA. Fat mass fell 33.9% and lean mass 10.9% on tirzepatide; the paper's own summary is that roughly 75% of the weight lost was fat and about 25% was lean mass (Look 2025). A peer-reviewed review reading the supplementary data from the STEP 1 sub-study puts the semaglutide figure nearer 40% of the kilograms lost (Mechanick 2025). Those two figures are not equally strong: the 25% is a verbatim sentence in an indexed sub-study reporting both arms, while the 40% is reconstructed from a conference abstract's appendix, so it should be read as one review's reading rather than as a settled number.
Ordinary dieting sits in the same territory. Pooled dietary studies found a median of about 14% of weight lost as fat-free mass on standard low-calorie diets, rising to roughly 23% on very-low-calorie diets, and differing by sex — around 27% in men and 20% in women (Chaston 2007). A 2024 review restates those figures and warns against treating any single percentage as fixed (Tinsley 2024).
The widely repeated "a quarter of weight lost is lean tissue" rule has been examined at length and criticised as an oversimplification that shifts with age, inactivity and exercise (Heymsfield 2014). The paper most often cited for the quarter rule is in fact the paper arguing against it. What survives the criticism is the shape of the problem rather than the arithmetic: a meaningful share of any substantial weight loss is lean tissue unless something is done about it, and how large that share is depends on the person and on what they do.
One thing follows from that which is easy to get wrong. A group-level ratio cannot be applied to an individual as a forecast. Nobody can tell a patient in advance what proportion of their loss will be lean tissue, and a clinic that quotes a single number as a prediction is making a claim the evidence does not support. How much muscle you lose on GLP-1 medication works through each of these figures and the weight each one carries.
Is the medication the reason?
No, and getting this backwards leads to the wrong response.
In the SURMOUNT-1 sub-study the proportion of weight lost as lean mass was approximately 25% in the tirzepatide arm and approximately 25% in the placebo arm (Look 2025). The placebo arm was diet alone. Losing a large amount of body weight costs lean tissue whether the deficit comes from a medication, a diet, or anything else. If the medicine were the cause, the sensible response would be to avoid it. Because the deficit is the cause, the response is to change what happens around the deficit — which is something a patient can act on.
A related error runs the other way. Some summaries describe these sub-studies as showing that lean body mass increased on a GLP-1 medication. It did not. Absolute lean mass fell; what rose was the share of remaining body mass that is lean tissue, because fat fell faster (Wilding 2021). Those are opposite claims and they are easy to conflate. At GetLean, our philosophy is that the medication is the catalyst: it creates the deficit, and the deficit is neutral about which tissue it takes.
What actually protects lean tissue
Two inputs, and they do different jobs.
A resistance-training stimulus. This is one of the better-evidenced findings in the area. A meta-analysis of 114 trials covering 4,184 people with overweight and obesity found lean mass statistically unchanged when resistance training accompanied caloric restriction (Lopez 2022). In obese older adults specifically, six randomised trials pooled together found that adding resistance training to caloric restriction prevented an estimated 93.5% of the lean-mass loss otherwise seen, without blunting fat loss (Sardeli 2018); that figure comes from an older-adult population and should not be assumed to hold at every age. Pooling 34 randomised trials of exercise during calorie restriction, adding exercise of any kind prevented roughly 46% of the fat-free mass that would otherwise have been lost, with combined and strength training reaching statistical significance and endurance training alone falling just short — though the direct comparison between training modes was not significant (Deller 2026).
Enough protein. Higher-protein intakes during energy restriction preserve lean mass better than lower-protein ones, in the range of 1.2 to 1.6 grams per kilogram of body weight per day (Leidy 2015). In one four-week trial in 40 untrained overweight young men on a large supervised deficit with six days a week of resistance and interval training, the group eating 2.4 g/kg/day gained 1.2 kg of lean mass and lost 4.8 kg of fat, while the group at 1.2 g/kg/day gained 0.1 kg of lean mass — a change not different from zero — and lost 3.5 kg of fat (Longland 2016). Those conditions were unusually aggressive and unusually supervised, so the result illustrates what the two levers can do together rather than describing a typical outcome. Individual results vary.
Neither input substitutes for the other, and how much of each is enough is worked through on its own. Protein without a training stimulus gives the body material with no signal that the tissue is needed; training without protein gives the signal with no material — eating and training lean in Singapore renders both into hawker food, a public gym and an outdoor fitness corner. The full mechanics of holding fat loss and muscle gain in the same period are in is losing weight the same as losing fat, and the harder question of whether new muscle can be built during a deficit — mostly a question of training history — is in can you build muscle on a GLP-1 medication.
Worth clearing up in the same breath: there is no separate category of training that "tones". Taken to failure, light and heavy loads produce similar muscle growth (Schoenfeld 2017, load), and what people mean by toned is a ratio — muscle present, fat over it reduced. Why "toned" is a body-composition outcome rather than a workout style covers the load and volume evidence behind that.
Where it goes wrong: the two failure modes
The first is arriving at a normal weight with the wrong composition. The informal term is "skinny fat"; the research term is normal weight obesity — a BMI in the normal range combined with a high body-fat percentage and low muscle. In a cohort of 6,171 adults, normal-BMI adults with high body fat carried more cardiometabolic risk factors, and in women specifically an adjusted hazard ratio of 2.2 for cardiovascular mortality; in men, body fat was not associated with cardiovascular mortality in the same analysis (Romero-Corral 2010). That sex difference is part of the finding and should not be smoothed over. Where low muscle and excess fat coexist, the pooled association is clearer: across 23 studies and about 51,000 adults, sarcopenic obesity carried roughly 21% higher relative risk of all-cause mortality, on definitions that varied between studies (Zhang 2019).
This matters more in Singapore than the international literature implies. A four-compartment study of Singaporean Chinese, Malay and Indian adults found a Caucasian-derived BMI equation under-predicted body-fat percentage by 2.7 to 5.6 percentage points, with the equivalent of a Caucasian BMI of 30 sitting nearer 27 for Chinese and Malays and 26 for Indians (Deurenberg-Yap 2000). Singapore's own guidelines run on BMI thresholds of 23 for overweight and 27.5 for obesity (HPB–MOH 2016). A normal number on a Western scale can sit over a composition that is not normal at all. What "skinny fat" means, and how to avoid ending up there covers the local picture.
The second is losing weight on top of a decline that is already running. Muscle mass falls roughly 8% per decade until about 70 and then faster, at 13 to 24% per decade (Filippin 2015). Strength falls faster still — studies measuring both in the same people report strength lost two to five times faster than mass, and strength loss is the more consistent predictor of disability and death (Mitchell 2012). Losing weight badly in mid-life adds to a trend that was already moving. Getting lean after 40 sets out the arithmetic.
The metabolic argument, and its limits
After weight loss, energy expenditure falls by more than the change in body size predicts. That was demonstrated under controlled conditions in 41 people, and it happened in participants who had never been obese as well as in those who had (Leibel 1995). It is a normal response to a smaller body, not a sign of anything having gone wrong.
Some of it is attributable to having less lean tissue, which is one reason lean mass is worth protecting — but only some of it, and the popular version of this claim runs well past the evidence. Six years after an extreme televised competition, 14 participants still showed resting metabolic rates several hundred kilocalories a day below what their body composition predicted (Fothergill 2016). That is a striking finding and a very unusual population: a mean loss of 58 kg under competition conditions, in fourteen people. The authors' own description of the adaptation is "proportional, but incomplete" — which is a long way from the claim that dieting permanently breaks a metabolism. No intervention has been shown to prevent the adaptation itself. Metabolic adaptation explained separates what the studies show from what circulates.
How to measure the difference
Four measurements, in order of how cheap they are.
Waist, taken the same way each time. Sensitive to fat, insensitive to the muscle that is offsetting it on the scale. Across 78 studies in 14 countries, a boundary of about half your height discriminated cardiometabolic risk better than either waist circumference or BMI alone (Browning 2010). Singapore's guidelines set waist action points above 90 cm in men and 80 cm in women (HPB–MOH 2016). It costs a tape measure. Waist-to-height ratio covers how to take the measurement and what the ratio does and does not tell you.
Body-fat percentage, used as a trend and nothing more. There is no authoritative healthy range to compare a reading against. The paper most often cited for these ranges states in its own introduction that no accepted published ranges of percentage body fat exist, and derives its proposal by applying BMI cut-offs to a regression (Gallagher 2000). A DXA study of 537 Singaporean adults reported the same absence of a consensus threshold, and no Asian-specific one either (Chen 2021). A number that has no reference range can still be useful as a direction of travel on one device over time. Body fat percentage vs BMI vs weight explains which of the three answers which question.
A body-composition scan, repeated on the same device. Across fifteen bioimpedance devices tested against a four-compartment model, only a third met a strict accuracy standard for a single measurement, while most tracked change over 12 to 16 weeks considerably better (Siedler 2022). The practical reading is that consistency beats precision: the same machine, the same conditions, repeated.
GetLean does not ask patients for a body-composition scan. The programme runs entirely by telehealth, and what is tracked is weight, reported through the daily WhatsApp check-ins, together with the habits those check-ins are built around. The scan evidence above is for readers who choose to measure on their own account.
Strength in training — tracked for its own sake, not as a proxy. This is the one most often misused. In a randomised trial, about 7% weight loss by dieting alone reduced whole-body lean mass by around 2% and lower-body lean mass by around 4%, while measured muscle strength did not change at all (Weiss 2017). Strength and muscle mass are correlated across people and dissociable within one person over months. Rising training loads are worth having, worth recording, and worth the confidence they give — and they are not evidence that lean mass is being held.
What a good result actually looks like
It has two phases, and the second is the longer one.
Phase one is the deficit: fat comes off, and the job is to make sure that as much as possible of what leaves is fat. Phase two is holding it, and it has no end date. The published trials are unambiguous that the second phase is where results are lost. Adults who came off semaglutide after 68 weeks regained roughly two-thirds of what they had lost within the following year (Wilding 2022). The two phases of getting lean covers what each phase asks for.
There is a genuine gap in the evidence here worth stating plainly. Nobody has measured what regained weight is made of. The largest meta-analysis of GLP-1 discontinuation pooled body weight, waist circumference and BMI, and no fat-versus-lean split at all (Berg 2025). The claim that it all returns as fat is an extrapolation from a different literature. The case for protecting muscle does not need it — it rests on the composition of the weight lost, which has been measured.
What a good result looks like week to week is unglamorous, and that is a feature. Protein hit at the right denominator, two or three hard resistance sessions, walking, and three measurements that are not the scale. What a good week of getting lean actually looks like puts it into a concrete week.
Clinical-trial figures describe the populations that were studied; individual results vary and are not guaranteed. If you are considering treatment, check your eligibility and speak to a doctor about whether it is suitable for you.
Common questions
What is the difference between losing weight and getting lean?
Losing weight is a change in a total. Getting lean is a change in the ratio underneath it — fat down, muscle held. Every kilogram lost is a mixture of fat and lean tissue, and only the mixture tells you whether the result is worth having.
How much of the weight lost is muscle?
It depends on the study, and there is no fixed figure. In the SURMOUNT-1 body-composition sub-study of 160 people, about 25% of the weight lost was lean mass (Look 2025). In ordinary dieting it ran around 14% on standard low-calorie diets and about 23% on very-low-calorie diets (Chaston 2007). The share moves with the size of the deficit, sex, age and training (Heymsfield 2014), so a group average cannot be read as a prediction for one person.
Does GLP-1 medication cause more muscle loss than dieting?
The evidence does not show that. In the SURMOUNT-1 sub-study the lean share of weight lost was about 25% in the drug arm and about 25% in the placebo arm, which was diet alone (Look 2025). The muscle question belongs to substantial weight loss, not to the medication.
Does GLP-1 medication build muscle?
No. In the body-composition sub-studies, absolute lean mass fell; what rose was the share of remaining body mass that is lean tissue, because fat fell faster (Wilding 2021). Those are opposite claims. Muscle is protected by a resistance-training stimulus and enough protein, not by the medication.
What is a healthy body-fat percentage?
There is no authoritative answer to publish. The paper most often cited for these ranges states in its own introduction that no accepted published ranges of percentage body fat exist, and derives its proposal from BMI cut-offs rather than from health outcomes (Gallagher 2000). A DXA study of 537 Singaporean adults reported the same absence of a consensus or Asian-specific threshold (Chen 2021).
If the scale barely moves, is anything happening?
Possibly a great deal. Fat can fall while lean tissue holds or rises, which shows up as a small net change in weight and a large change in how a body looks and functions. This is why waist, training loads and a repeated body-composition measurement carry information the scale does not.