The scale reports total mass. It cannot report what that mass is made of, and on GLP-1 medication that distinction decides the result. Two people can lose the same amount of weight — one keeping almost all of their muscle, the other giving up a substantial share of it as lean tissue — and the scale will describe both identically. This article covers why body weight is a weak signal, what the evidence supports tracking instead, and how often to look at any of it.
Body composition: the proportions of fat mass and lean mass that make up body weight. Two bodies of identical weight can have entirely different compositions.
What is the scale actually measuring?
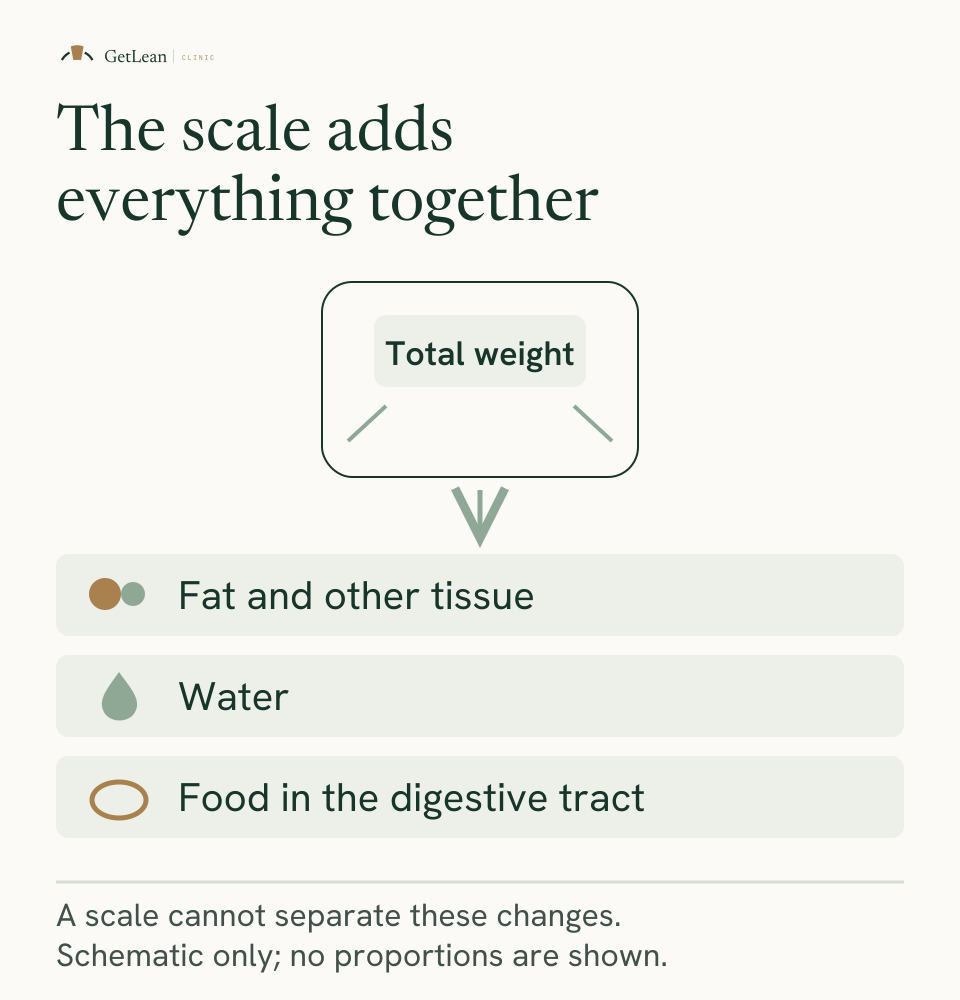
One number, formed by adding together at least two things that behave differently.
In the SURMOUNT-1 body-composition sub-study, DXA scans of 160 participants found that of the body weight lost, approximately 75% was fat mass and 25% was lean mass (Look 2025). The same 25%-ish split appeared in the placebo arm. In pooled dieting studies the share lost as fat-free mass ranged from about 14% on standard low-calorie diets to about 23% on very-low-calorie diets (Chaston 2007).
Those percentages are the whole argument. A kilogram is not a unit of progress, because the composition of each kilogram varies with how severe the deficit is, who is losing the weight, and what else they are doing. The scale collapses that variation into a single figure and discards the part that matters.
There is a second problem, which is that body weight fluctuates for reasons unrelated to fat or muscle. Hydration, food volume in the digestive tract, glycogen stores and, for women, menstrual-cycle timing all move the reading. A single measurement is a noisy sample of a slow-moving trend.
Why this matters more on GLP-1 medication
Because the amount of weight lost can be much larger than most people have experienced from dieting, which makes the scale unusually persuasive at exactly the moment it is least informative.
When a diet produces a small change over a few months, nobody organises their self-assessment around the number. When the change is much larger, the number becomes the story — and the composition question goes unasked precisely because the headline figure looks so good.
That is the failure mode. Someone whose weight is falling steadily has no reason from the scale to suspect that a meaningful share of it is lean tissue. The scale will not tell them. It reports the same downward line either way, and it reports it faster and more dramatically than the underlying composition change deserves.
At GetLean, our philosophy is that a falling scale reading on its own is an incomplete picture rather than a result — the medication is the catalyst, and what you keep is the outcome.
What should you track instead?
Three things, none of which require equipment beyond a tape measure.
Waist-to-height ratio. Divide waist circumference by height in the same units. A systematic review of 78 studies across 14 countries found a boundary value of approximately 0.50 for both men and women best discriminated cardiometabolic risk — the public-health version being to keep your waist under half your height (Browning 2010). A separate meta-analysis pooling more than 300,000 adults found waist-to-height ratio discriminated risk factors modestly better than either waist circumference or BMI, improving discrimination over BMI by 4–5% (Ashwell 2012). That is an improvement in a screening statistic, not a claim that it detects 4–5% more disease.
Waist has a practical advantage on top of the evidence: it responds to fat loss and is largely unmoved by the muscle that offsets fat on the scale.
Strength. Loads and repetitions going up over weeks is the most direct available evidence that muscle is being stimulated rather than surrendered. It is also independently meaningful. In a cohort of 139,691 adults across 17 countries, each 5 kg lower grip strength was associated with a 16% higher hazard of all-cause mortality and a 17% higher hazard of cardiovascular mortality (Leong 2015). That is an observational association, and grip strength is a measure of strength rather than of muscle mass — but it is not nothing that the strength measure carries prognostic weight.
How clothes fit. Unscientific and genuinely useful, because it integrates shape change over time in a way a single number does not.
What about BMI and body-fat scales?
Both have a role, and both are routinely asked to do more than they can.
BMI is a population screening tool. It does not describe an individual body, and in Singapore the mismatch is larger than usual. Using a four-compartment reference model in 291 Singaporean Chinese, Malay and Indian adults, a Caucasian-derived prediction equation under-predicted body-fat percentage by 2.7 to 5.6 percentage points (Deurenberg-Yap 2000). A given BMI here corresponds to more body fat than the same BMI predicts elsewhere, which is why Singapore's clinical practice guidelines set the overweight threshold at a BMI of 23 and the obesity threshold at 27.5, rather than the international 25 and 30 (HPB-MOH 2016).
Consumer body-fat scales use bioelectrical impedance, and the useful way to think about them is that they are better at detecting change than at reporting a true value. Testing fifteen bioimpedance devices against a four-compartment reference model, only five of fifteen met a ±2% equivalence standard for a single cross-sectional measurement — but nine of fifteen met a ±1% standard for tracking change over 12–16 weeks (Siedler 2022).
So the body-fat percentage on a home scale should not be treated as a fact about the body. The direction it moves over three months, measured the same way each time, is worth more than any single reading. We cover the full comparison, including clinic-grade options, in what each body-composition test actually measures.
How often should any of this be measured?
Less often than instinct suggests, and consistently.
Weight, if it is tracked at all, is most useful as a multi-week trend rather than a daily verdict — same time of day, same conditions. Waist measurement monthly is enough to see real movement without chasing noise. Strength is tracked every session by default, which is part of why it is such a good signal.
For anything measured by a device, the interval matters because measurement error does not shrink just because you look more often. Bioimpedance devices tracked change acceptably over a 12–16 week window in the study above (Siedler 2022); asking one to resolve a two-week difference is asking it to report noise.
Individual results vary. If progress stalls for an extended period, or if anything feels wrong, that is a conversation with your doctor rather than a measurement problem.
Common questions
Why is my weight not moving on GLP-1 medication?
Body weight is the sum of fat and lean-mass changes, and those can move in opposite directions. If fat is falling while muscle is being held or added, the scale understates what has actually happened. Waist measurement and training loads pick this up. If a stall continues for an extended period, raise it with your doctor.
What should I track instead of weight?
Waist-to-height ratio, strength in training, and how clothes fit. A waist under half your height was the boundary that best discriminated cardiometabolic risk across 78 studies in 14 countries (Browning 2010), and waist-to-height ratio outperformed both waist circumference and BMI in a meta-analysis of over 300,000 adults (Ashwell 2012).
How often should I weigh myself?
Less often than most people do, and always under the same conditions — same time of day, same state. Body weight moves with hydration, food volume and glycogen, so a single reading is a noisy sample. A trend across several weeks is the meaningful unit.
Is BMI useful at all?
As a population screening tool, yes. As a description of an individual body, no. In Singaporeans, a given BMI corresponds to a higher body-fat percentage than the same BMI predicts in Caucasian populations, by roughly 2.7 to 5.6 percentage points in one four-compartment study (Deurenberg-Yap 2000).
Are body-fat scales accurate enough to track progress?
They are better at tracking change than at reporting an accurate absolute value. Across fifteen bioimpedance devices tested against a four-compartment model, only five met a ±2% standard for a single measurement, while nine met a ±1% standard for change over 12–16 weeks (Siedler 2022). Use the trend, not the number.