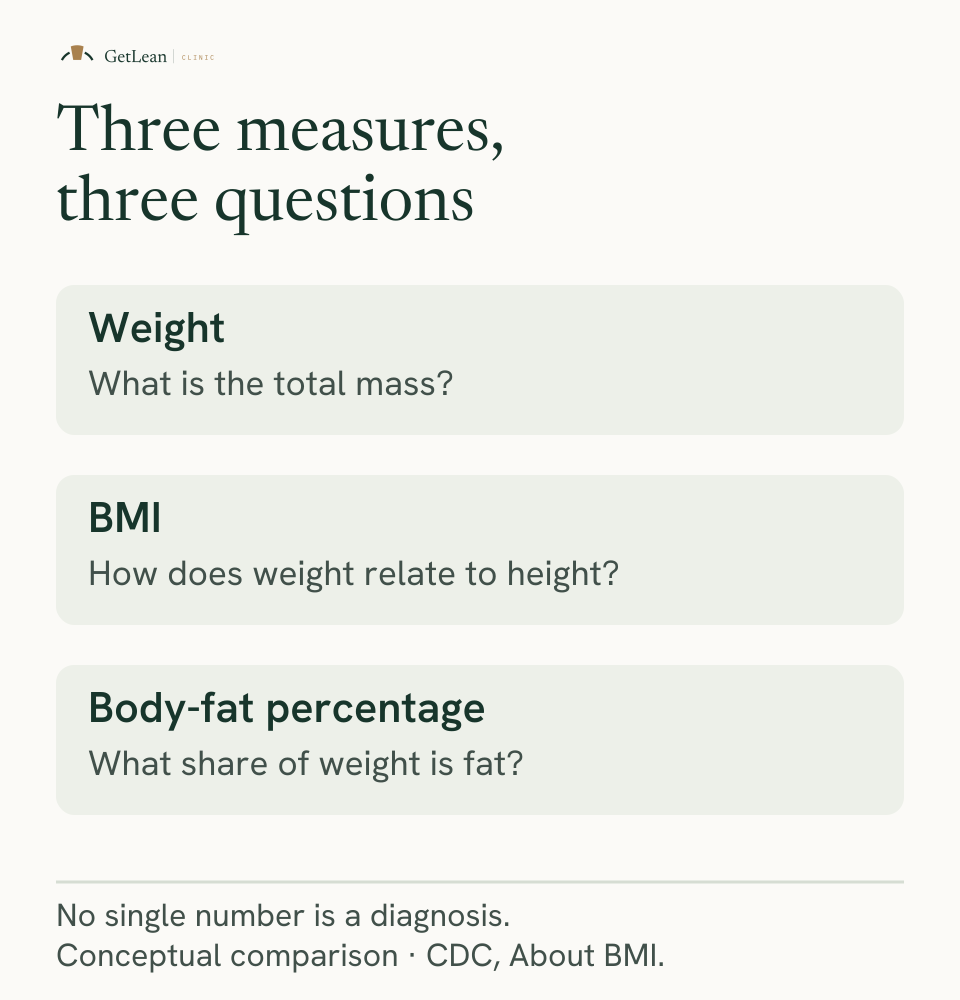
Three numbers get used to answer the same question, and each answers a different one. Body weight measures total mass. BMI is a screening ratio built for populations. Body fat percentage describes composition — and, awkwardly for everyone who quotes a target for it, has no authoritative healthy range at all. This article covers what each is for, what each is not, and which one is worth your attention.
Screening tool: a measure designed to sort a population into groups worth looking at more closely. Not designed to describe an individual body.
Body fat percentage: the number with no official range
This is the finding most likely to surprise you, so it is worth stating carefully.
There is no authoritative healthy body-fat-percentage range for adults. Not from the WHO, whose obesity classification is BMI-based. Not as a position stand from a major exercise-science body. And not from Singapore's HPB or MOH.
The paper most often cited as the source says so itself. Its own introduction, written in 2000, states that "no accepted published ranges of percentage body fat currently exist" — and the ranges it then proposes are back-calculated by applying WHO BMI cut-offs to a regression using BMI, age and sex (Gallagher 2000). That is a statistical derivation from a different measure, not a threshold derived from health outcomes, and no consensus body has since adopted it.
A 2021 Singapore study reaches the same conclusion for this region, noting the absence of a consensus body-fat threshold for overweight and obesity, and of an Asian consensus cut-off point (Chen 2021).
The figures you will see quoted — a range for men, another for women — come from textbooks, certifying bodies and percentile charts, and different sources give materially different numbers. That inconsistency is itself the evidence. Treat any specific target you are given as unsourced until someone shows you where it comes from.
What body fat percentage is still good for: direction over time, on the same device. It tells you whether composition is moving, which body weight cannot.
BMI: useful for populations, weak for individuals
BMI works at scale and poorly one person at a time. It cannot distinguish muscle from fat, and it does not describe where fat is carried.
It also travels badly between populations. Using a four-compartment reference model in 291 Singaporean Chinese, Malay and Indian adults, a Caucasian-derived prediction equation under-predicted body-fat percentage by 2.7 to 5.6 percentage points (Deurenberg-Yap 2000). A given BMI here corresponds to more body fat than the same BMI predicts elsewhere.
Singapore's guidelines reflect that. The HPB-MOH clinical practice guidelines set the overweight threshold at a BMI of 23 and obesity at 27.5, rather than the international 25 and 30 (HPB-MOH 2016). We cover the reasoning in why Asian BMI thresholds are lower.
None of that makes BMI useless. It makes it a starting point that a clinician refines, rather than a verdict.
The gap between them
The clearest demonstration of why one number is not enough: people whose BMI is normal and whose body fat is high.
In an analysis of 6,171 adults, people with a BMI of 18.5–24.9 and a high body-fat percentage had a higher prevalence of dyslipidaemia, more hypertension among men, and — among women — a significantly higher risk of cardiovascular mortality, an adjusted hazard ratio of 2.2 (Romero-Corral 2010). In the same study, body fat was not associated with cardiovascular mortality in men.
BMI did not identify those people. That is the case for looking at composition, made without needing a threshold to compare against. We cover it in what "skinny fat" means.
What to actually use
Waist-to-height ratio. Divide your waist by your height in the same units. A boundary of about 0.50 for both men and women best discriminated cardiometabolic risk across 78 studies in 14 countries (Browning 2010) — keep your waist under half your height. It costs a tape measure, it has an actual evidence-based boundary, and it responds to fat loss without being confused by the muscle you are trying to keep.
Strength in training. Loads going up over weeks is the most direct signal that lean tissue is being preserved rather than surrendered, and it is available every session.
Body fat percentage as a trend, on one device. Across fifteen bioimpedance devices tested against a four-compartment reference, only five met a ±2% standard for a single measurement — but nine met a stricter ±1% standard for tracking change over 12 to 16 weeks (Siedler 2022). The direction is worth more than the digits. What each test actually measures covers the options.
Body weight, occasionally and unemotionally. It is a noisy sample of a slow trend, and it cannot tell you what the change is made of.
At GetLean, our philosophy is that the composition is the goal and the weight is a by-product. Choosing the right number to watch is most of what that means in practice.
Individual circumstances vary, and none of these measures replaces an assessment by a doctor.
Common questions
What is a healthy body fat percentage?
There is no authoritative answer. No WHO or consensus-body range exists, the most-cited paper states in its own introduction that none existed and derives its proposal from BMI cut-offs (Gallagher 2000), and a Singapore study confirms no Asian consensus threshold either (Chen 2021). Treat any specific target you are given with suspicion.
Is BMI useless?
No. It is a population screening tool that performs poorly for individuals. Singapore's own guidelines use it with lower thresholds — 23 for overweight and 27.5 for obesity (HPB-MOH 2016).
What should I track instead?
Waist-to-height ratio is the most useful cheap measure — a boundary of about 0.5 best discriminated cardiometabolic risk across 78 studies (Browning 2010) — alongside strength in training.
Can I trust the body fat percentage on my scale?
As a trend, not as a number. Across fifteen bioimpedance devices only a third met a ±2% accuracy standard for one measurement, though most tracked change better over 12-16 weeks (Siedler 2022).
Does BMI work differently for Asian populations?
Yes. In Singaporeans, a given BMI corresponds to a body-fat percentage 2.7 to 5.6 percentage points higher than a Caucasian-derived equation predicts (Deurenberg-Yap 2000), which is why local thresholds sit lower.