Metabolically healthy obesity describes a real group of people, but the long cohorts show it is usually a phase rather than a type: almost half of them in one US study and about 40% in a Chinese one had become metabolically unhealthy within a decade (Mongraw-Chaffin 2018, Gao 2020). The second thing to know is that every risk number attached to the label depends on which group it was measured against — change the comparison and the estimate moves, and in one Asian analysis it reverses. This article sets out what the cohorts found, why the comparator matters that much, and which measurements Singapore actually runs on.
Metabolically healthy obesity: meeting a BMI definition of obesity while showing few or none of the metabolic abnormalities that usually accompany it — raised blood pressure, raised fasting glucose, high triglycerides, low HDL cholesterol, a large waist. Definitions vary between studies, which is part of why the numbers do.
What happened when researchers followed these people for a decade
In the Multi-Ethnic Study of Atherosclerosis, 6,809 US adults were followed for a median of 12.2 years. Compared with metabolically healthy normal weight, baseline metabolically healthy obesity was not significantly associated with incident cardiovascular disease. But almost one-half of that group developed metabolic syndrome during follow-up, and those who did had 60% higher odds of cardiovascular disease (OR 1.60, 95% CI 1.14–2.25). The longer metabolic syndrome was present, the higher the odds — 1.62 at one visit, 1.92 at two, 2.33 at three or more — and metabolic syndrome mediated about 62% of the relationship between obesity at any point and cardiovascular disease. The authors' conclusion is unambiguous: metabolically healthy obesity "is not a stable or reliable indicator of future risk" (Mongraw-Chaffin 2018).
The China Kadoorie Biobank followed 458,246 Chinese adults for a median ten years, using Chinese BMI categories in which obesity begins at 28. About 40% transitioned to metabolically unhealthy status. That transition carried a 53% higher risk of a major vascular event (HR 1.53, 1.34–1.75), and staying metabolically unhealthy carried more than double (HR 2.22, 2.00–2.47). Unlike the US cohort, baseline metabolically healthy obesity was itself associated with higher risk of all types of cardiovascular disease, and the authors state that obesity remains a risk factor independent of major metabolic factors (Gao 2020).
The two disagree on whether the baseline label carries risk on its own. They agree completely on instability. Both are observational, and the Chinese cohort's authors note that lipid fractions, fasting plasma glucose and visceral fat were not measured, so the classification is coarse.
Why the same condition gets several different risk numbers
Because the comparison group is doing most of the work.
The most-cited meta-analysis pooled eight prospective studies, 61,386 people and 3,988 events. Metabolically healthy obesity carried a relative risk of 1.24 (1.02–1.55) against metabolically healthy normal weight — only when the analysis was restricted to studies with at least ten years of follow-up. In shorter studies the excess was not there. The number the same paper reports and almost nobody quotes is more striking: metabolically unhealthy normal weight carried a relative risk of 3.14, higher than metabolically unhealthy overweight at 2.70 and metabolically unhealthy obesity at 2.65 (Kramer 2013).
The Asian meta-analysis makes the comparator problem explicit. Across 19 studies in Asian populations, metabolically healthy obesity carried 61% higher odds of cardiovascular disease than metabolically healthy normal weight (OR 1.61, 1.24–2.08), and no significant difference at all against metabolically healthy non-obese (OR 1.04, 0.80–1.36) — a group that includes people classified overweight. The all-cause mortality result reverses direction between the same two comparisons. Heterogeneity was high, and the authors' own conclusion is that future studies should select control groups carefully (Huang 2020). The lower mortality figure in one of those comparisons is a comparator artefact the authors flag, not a benefit of carrying extra weight.
A third study shows how much the definition of "healthy" matters. Across 3.5 million UK primary-care records, people with obesity and none of diabetes, hypertension or hyperlipidaemia still had about 49% higher risk of coronary heart disease and 96% higher risk of heart failure than normal-weight people with none of those conditions (Caleyachetty 2017). That definition counts only three diagnosed conditions — no waist measurement, no triglycerides, no HDL — so people whom the other studies would classify as unhealthy are counted healthy here, which inflates the apparent risk of the healthy group. Mean follow-up was 5.4 years.
So a single "the risk of metabolically healthy obesity is X" sentence, with no comparator and no follow-up length attached, is not a finding. It is a number with its conditions stripped off.
Where "TOFI" came from, and what it is not
The term was proposed in a 2012 study that scanned 477 white UK volunteers — 243 men and 234 women — with whole-body MRI and proton spectroscopy. The authors found a large variation in internal abdominal fat and liver fat that clinical measures of obesity did not predict, and proposed "thin on the outside, fat on the inside" as a subphenotype for people at increased metabolic risk (Thomas 2012).
Three things follow from how that study was built. It is a reference-range study, so nobody was followed and no disease event was counted — "at increased metabolic risk" is the authors' inference from the imaging, not a measured outcome. TOFI is a proposed subphenotype rather than a diagnosis or a validated category. And every participant was white, which matters for the next section. The paper also found waist circumference to be the strongest single predictor in men and BMI in women, a sex asymmetry the popular version drops.
What the Asian data adds
The follow-up study in Asian populations recruited 199 Chinese and 158 Caucasian adults in Auckland at similar age and BMI. Chinese participants had lower body weight but a greater percentage of total abdominal adipose tissue and a greater percentage of visceral adipose tissue (all P<0.005), with higher fasting glucose, HbA1c, fasting insulin and triglycerides. The sentence that matters most: lean Chinese women below BMI 25 carried more total abdominal and visceral fat in absolute kilograms than Caucasian women, with raised fasting glucose and insulin resistance (Sequeira 2020). It is a New Zealand study with no Malay or Indian group, it is cross-sectional, and nobody developed diabetes during it.
Singapore's own imaging data is thinner and narrower. In 22 age- and BMI-matched pairs, non-obese postmenopausal Chinese-Singaporean women had similar absolute visceral, subcutaneous and total abdominal fat to Caucasian women — what differed was the ratio, with visceral-to-subcutaneous 24.5% higher and visceral-to-total 18.2% higher. In the Singaporean group, BMI did not correlate with visceral adiposity at all (Kalimeri 2021). Every participant was a postmenopausal woman and there were 22 per group.
In men, the Singapore study that exists compared 120 Chinese and Indian men over 60 by CT. Visceral fat correlated better with cardiometabolic risk factors than waist circumference or BMI did, and waist was only a moderate proxy for it (r = 0.484 in Chinese men, 0.366 in Indian men). The two ethnic groups had similar visceral fat, while more Indian men carried diagnosed conditions (Ng 2012).
Separately, in 291 Singaporean Chinese, Malay and Indian adults measured by a four-compartment model, a Caucasian-derived equation under-predicted body-fat percentage by 2.7 to 5.6 percentage points, and the BMI equivalent to a Caucasian at BMI 30 worked out at about 27 for Chinese and Malays and about 26 for Indians (Deurenberg-Yap 2000). That study measured body-fat percentage and used no imaging, so it carries nothing about where the fat sits.
Why visceral fat keeps appearing in this discussion
In 3,001 Framingham participants scanned by CT, both visceral and subcutaneous fat were associated with blood pressure, fasting glucose, triglycerides and HDL. But after adjustment for BMI and waist circumference, only visceral fat still contributed significantly to the variation in risk factors (Fox 2007). Subcutaneous fat is not thereby harmless — unadjusted, it was associated with everything tested — and the study is cross-sectional.
Two international professional bodies describe visceral and ectopic fat as an independent risk marker for cardiovascular and metabolic morbidity and mortality, while noting that simple clinical tools for tracking it still need developing (Neeland 2019). Marker, not established causal factor, and not something a clinic can measure directly.
The measurements Singapore actually runs on
Singapore's national obesity guideline classifies overweight from BMI 23.0 and obesity from 27.5 for the local population, with waist-circumference action points above 90 cm for men and 80 cm for women (HPB-MOH 2016). Those numbers follow the WHO expert consultation that observed risk rising in Asian populations across a BMI range of 22–25 and proposed additional public-health action points at 23.0, 27.5, 32.5 and 37.5 — while explicitly retaining the international classification rather than replacing it (WHO 2004). The reasoning is set out in why Asian BMI thresholds are lower.
What Singapore does not publish is a body-fat percentage. A DXA study of 537 Singaporean adults found body fat higher than the same BMI, age and sex would predict in Caucasian reference populations — and stated plainly that there is no clear consensus body-fat threshold for overweight and obesity, and no Asian consensus cut-off (Yishun Study 2021). Any body-fat percentage presented as an official Singapore figure is not one.
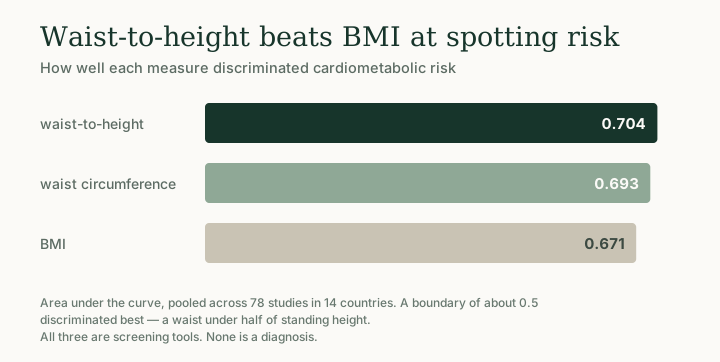
The simple measure with the best pooled performance is waist-to-height ratio. Across 78 studies in 14 countries, a boundary of about 0.5 — keep your waist under half your height — discriminated cardiometabolic risk better than waist circumference or BMI, with a mean area under the curve of 0.704 against 0.693 and 0.671 (Browning 2010). It is a screening heuristic pooled from heterogeneous studies rather than a diagnostic cut-point, and how to use it is covered separately.
The mirror-image case, which is the one people miss
The idea that a normal BMI can hide obesity-like metabolism is older than the TOFI literature. The "metabolically obese, normal-weight" concept describes normal-weight people with hyperinsulinaemia and insulin resistance at elevated risk, identifiable by central fat distribution, inactivity and low fitness rather than by weight (Ruderman 1998). It is a narrative synthesis, so it carries no prevalence figure.
The measured version comes from NHANES III, where 6,171 adults with a BMI of 18.5–24.9 and a high body-fat percentage showed more dyslipidaemia, more hypertension in men and more cardiovascular disease in women. The mortality finding is specific and often misquoted: in women, adjusted hazard ratio 2.2 (1.03–4.67) for cardiovascular mortality; in men, no association at all (HR 0.99, 0.95–1.04) (Romero-Corral 2010). It is not a sex-neutral result and should never be presented as one.
Put next to the pooled meta-analysis, where metabolically unhealthy normal weight was the highest-risk group of the six examined (Kramer 2013), the picture that emerges is the one the whole literature keeps pointing at: the scale is answering a different question from the one being asked.
What a reader can take from this
The label is a snapshot, and what the cohorts measured was movement between categories. Nobody in this literature was randomised, so none of it shows that changing category changes an outcome — it shows which combinations of weight and metabolism track with which risks, over how long, against which comparison group.
The practical version is unglamorous. Singapore publishes BMI and waist as its action points, and waist-to-height is the better simple screen. Metabolic markers come from a blood test with your own doctor, who is also the person to interpret them. Whether treatment is appropriate for you is a clinical decision made at consultation with your full picture in front of the doctor — you can check your eligibility to start it.
If one of those markers has already come back abnormal, weight-related conditions covers what the evidence shows weight loss does about it — including blood pressure and fatty liver, the two that most often turn up on a screening report before any symptoms do.
Common questions
Can you be obese and metabolically healthy?
You can meet the definition at a point in time, but it tends not to last. In a US cohort followed a median 12 years, almost half of people classified metabolically healthy with obesity developed metabolic syndrome (Mongraw-Chaffin 2018), and in 458,246 Chinese adults followed ten years about 40% did (Gao 2020). Both papers describe it as a state that changes rather than a stable type.
Why do different articles give different risk numbers for metabolically healthy obesity?
Because the comparison group changes the answer. In the only Asian meta-analysis, metabolically healthy obesity carried 61% higher odds of cardiovascular disease against metabolically healthy normal weight, and no significant difference against metabolically healthy non-obese — and the mortality comparison reverses direction between those two (Huang 2020). The authors' own conclusion is that control groups must be chosen carefully.
What does TOFI mean and is it a diagnosis?
It stands for thin on the outside, fat on the inside, and it is not a diagnosis. It was proposed in a 2012 whole-body MRI study of 477 white UK volunteers as a subphenotype — a reference-range study in which nobody was followed and no disease event was counted (Thomas 2012).
Can you be a healthy weight and metabolically unhealthy?
Yes, and it is the higher-risk combination in the pooled data. In a meta-analysis of eight prospective studies, metabolically unhealthy normal weight carried a relative risk of 3.14 — higher than metabolically unhealthy obesity at 2.65 (Kramer 2013). In a separate cohort, normal-BMI adults with high body fat had more risk factors, and in women specifically higher cardiovascular mortality, with no such association in men (Romero-Corral 2010).
What should I look at instead of BMI?
In Singapore the published action points are BMI 23 and 27.5 plus a waist above 90 cm for men and 80 cm for women (HPB-MOH 2016). Waist-to-height ratio is the best-performing simple screen in the pooled data, with a boundary of about 0.5 (Browning 2010). No authoritative body-fat-percentage threshold exists to use, in Singapore or anywhere else (Yishun Study 2021).